Posts tagged with "Uncategorised"

The Catch 22 of Academic Publishing

A couple of interesting articles crossed my on-line reading list today. First of all, Chris Hall from the Swansea Learning lab posted a delicious.com bookmark to a Times Higher Education article which reported on a JISC Report on new models for academic publishing which concludes that “an “open-access” future for academic publishing would save money while boosting the profile of research and maximising its economic impact.” In The Guardian Technology supplement, Andrew Brown presents a similar argument in today’s Read me first column: “Digital Britain needs access to science journals, not YouTube.”

Unfortunately the curious mutually dependent relationship between the Academy and Academic publishing leads me to think that this is not going to change any time soon. Quality publications in peer-reviewed journals continues to be the metric that drives probation, tenure and promotion of staff and even the assessment of the Universities themselves. At the same time these same quality journals are controlled by the cartel of academic publishers, and are accessible, and therefore read, only by academics through the libraries that can afford the expensive annual subscriptions. It’s a real Catch 22 situation: academics need the journals and the journals need the academics to need the journals. The next RAE exercise, which will be based on publication impact metrics, will not use the economic benefits of publications, but rather which journal it is published in and who else has read and cited the paper. And this is only likely to strengthen the hold of the academic publishers. It would in fact be mutually assured destruction if the publishing model changed, even if the change would have a clear economic benefit.

I think there’s a clue in the name we give these publications. They are called archival journals, perhaps because they are archived, rather than read.

Snow!

The snow finally arrived in Swansea but brought with it the usual British “severe weather” madness. I received a Twitter tweet from a colleague that said that the University was closed and because I couldn’t believe it: I walked out into the pleasant wintry day to see if it was true. And it was! The entire staff was sent home at around 9.00 am. Students flooding in from Brynmill were turned away from lectures and were able to build snowmen and have snowball fights instead. This evening’s cinema performance at Taliesin was even cancelled. In terms of lost man hours, catering receipts and returned cinema tickets the University must have lost a fortune! And all those lost lectures will have to made up some how.

The irony was I could and did make it into work without problems! And so did many of my colleagues and students. If you want to know why Britain is going down the toilet, you need look no further than to how the nation reacts to a bit of snow!

At least, as we were told by the personnel manager later today, we won’t be docked a day’s wages!

Stop Press: The sun came out at 13.00 and already most of the productivity-stopping snow has already melted!

Posted by Picasa

Snow?

Snow in Singleton park 

According to the BBC, snow falls today caused major disruption to normal sevice of UK PLC. In Swansea, we had a light dusting as this shot of my route into work shows. Light snow showers expected tonight.

Posted by Picasa

Displaying Pie Charts with Google Chart API

<img src="http://blog.swansea.ac.uk/blog/eechris/2009/01/30/reflections-on-some-e-learning-feedback-part-1/" alt="Sample chart](http://chart.apis.google.com/chart?chs=350x150&chd=t:60,40&cht=p&chl=Strongly Agree|Strongly Disagree)

In one of my [current projects " title="" />I am publishing the results (in blog form) of the first assessment of my use of e-learning that I have ever formally tried. The majority of the questions use the Likert scale (where respondees are asked to rank their response to a statement along the scale of Strongly-agree to Strongly disagree) and I want to present the results with pie charts like this one. I could use Excel and export the charts, as gif images, for upload to my blog, but that’s not very Web 2.0! So instead I thought I’d use the Google Chart API instead. And here is an example of what can be achieved with a small bit of HTML magic.

The Google Chart API is a web service: you provide some information about the chart you want and it generates and returns a GIF image of the chart. The URL for the chart shown in this post is http://chart.apis.google.com/chart?chs=350×150&chd=t:60,40&cht=p&chl=Strongly Agree|Strongly Disagree. To embed a chart in an HTML document, just use the Chart API URL as the src attribute of an image as in:

&lt!-- Use of & in the src attribute to stand for the & in the URL
is not a spelling mistake!
You have to use the HTML entity in order to be able to embed &
in the URL! -->
Sample chartsrc="http://chart.apis.google.com/chart?chs=350x150
&chd=t:60,40
&cht=p
&aongly Agree|Strongly Disagree" />

<

p>Clearly, some familiarity with HTML is required to fully exploit this feature, but it’s well worth a look. Plus if you have a number of similar charts to produce, as my report will, you’ll probably find copy, paste and tweek to be much quicker than anything you could do with traditional desktop tools.

The History of the Internet

This (partial) history of the Internet (from Arpanet to Internet) has been created as a show case for a German student’s diploma project to develop a visual language for electronic communication called PICOL. I picked it up from Lee Lefever at CommonCraft. The video itself is hosted at VIMEO. I may us it in my upcoming module on Comunications for the Internet.
http://vimeo.com/moogaloop.swf?clip_id=2696386&server=vimeo.com&show_title=1&show_byline=1&show_portrait=0&color=&fullscreen=1
History of the Internet from PICOL on Vimeo.

Fire!

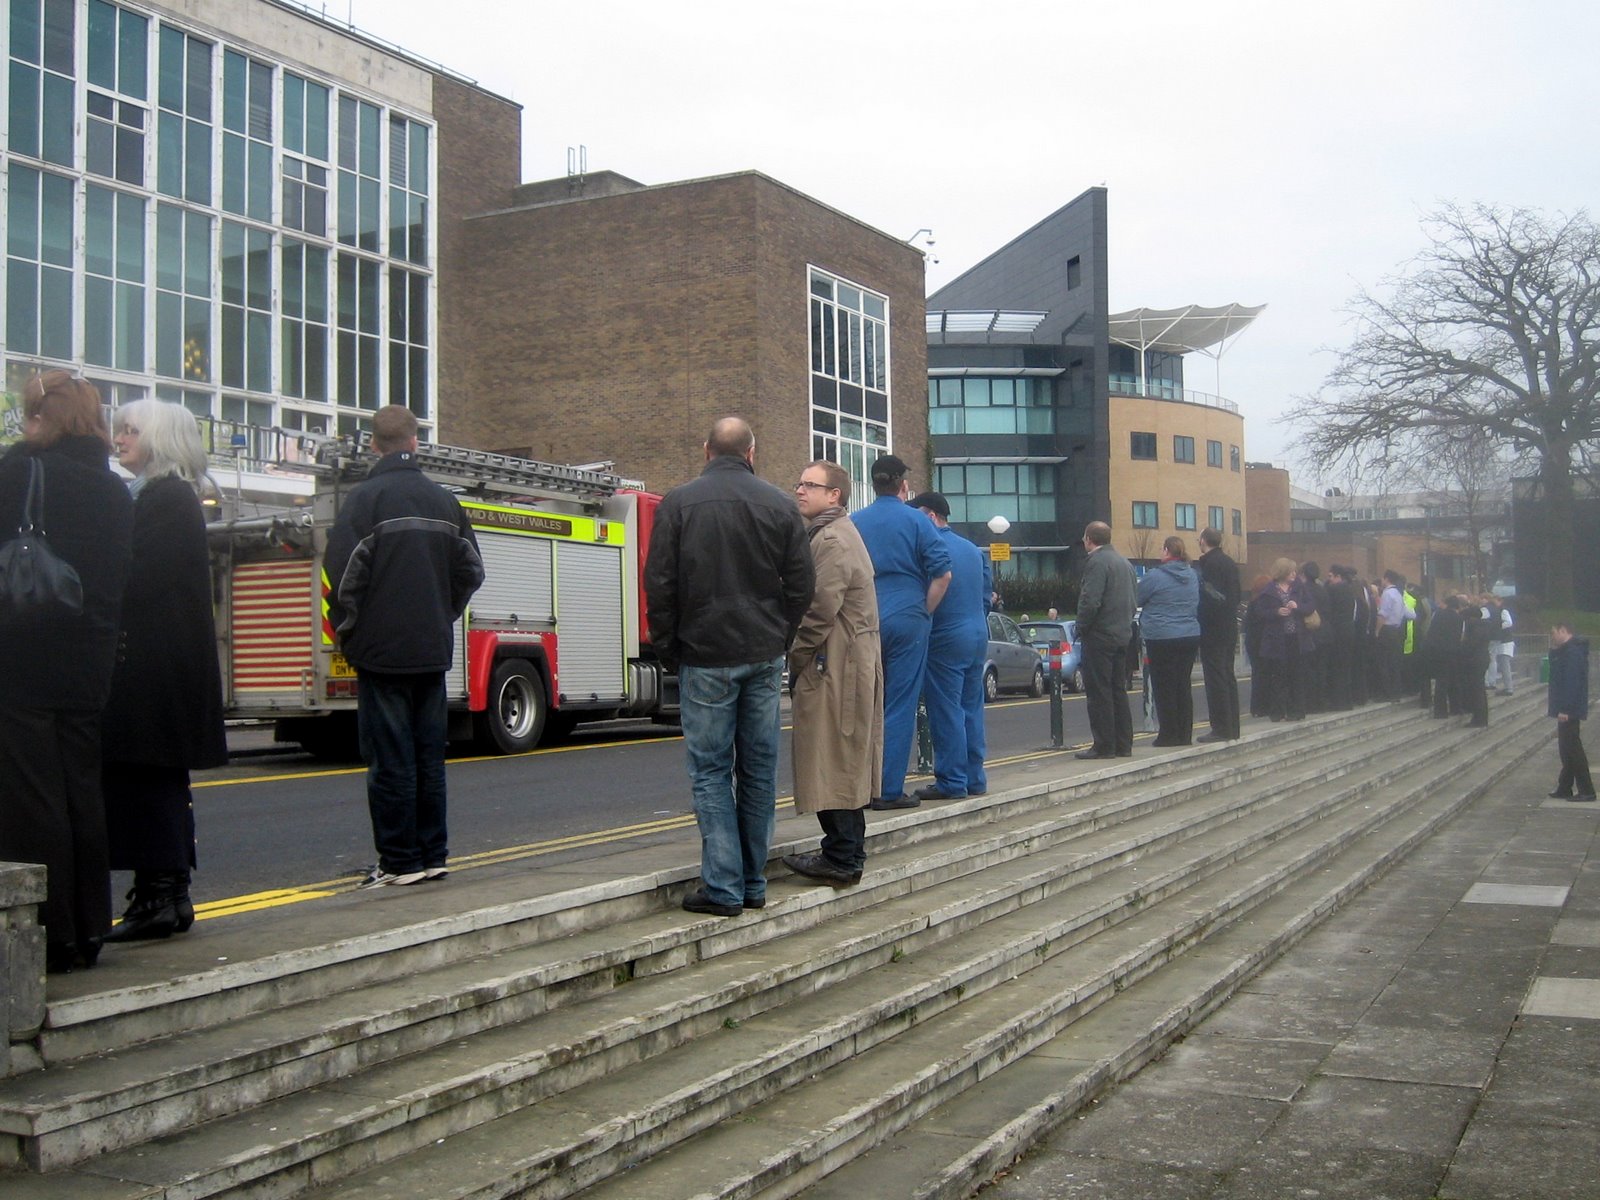
 Today, just as I sat down to eat my lunch of a bowl of soup and a sandwich, the fire alarm went off in Fulton house. It wasn’t a drill, but it wasn’t a fire either! Apparently, a fire detector has been sited too near to a steam outlet in one of the kitchens. Nonetheless, we all had to stand around outside in the cold until the alarm had been cancelled by the fire brigade. My soup was almost cold when I got back to it.

Posted by Picasa

Top Java Developers Offer Advice to Students

In a past life I used to teach Java as a first programming language to Electrical and Electronic Engineering and Information and Communication Technology students so I was interested when news of this article (published in java.sun.com /developer) was received via Geertjan Wielanda of the Netbeans Educational Resources site.

Two pieces of advice that I’d pass on are: 1. Knowledge of a subject doesn’t end when the exam finishes: a soup tastes better if the pot is left simmering for a long time after the meat is added! 2. Be open to the opportunities that letting the boundaries between modules fade away can bring. You’ll be suprised when that piece of obscure set theory suddenly becomes relevant.

A lesson I’ve learned is that you’ll never know everything, there will always be new things to learn and others to learn from. I’m still learning, and I hope to continue to do so. And I have probably learned more from my students, than they have ever learned from me.

RAE Results "Let loose the dogs of war"

At midnight the Higher Education Funding Council for England (HEFCE) released the results of the 2008 Research Assessment Exercise (RAE). All the newspapers will be busy analysing the results (although only the Guardian and the Times Higher seem to have gone to press with any great detail today) and will be publishing new League Tables and University Vice chancellors will be busy putting the best spin on the results.

The key issue will be how the research ratings will affect funding and most University’s have been desperately playing the transfer market over the last five years (to the detriment of teaching perhaps) in order to get the best possible score. However, the result is likely to be a net reduction in funding for most institutions, a slight increase for the lucky few, and a redistribution of funds for the rest. There’s no Champions league in Academia so I suspect that a lot of cash, time and energy has been expended to maintain the staus quo. Mathematicians call this sort of thing a zero-sum-game: it’s a pity that we’ve all been forced to play it.

For interest, here are the Guardian results for Swansea and our nearest rivals Cardiff, Bangor and Aberystwyth. Here’s my subject, this is education research and and here’s my Alma Mata.

Merry Christmas to My Reader!


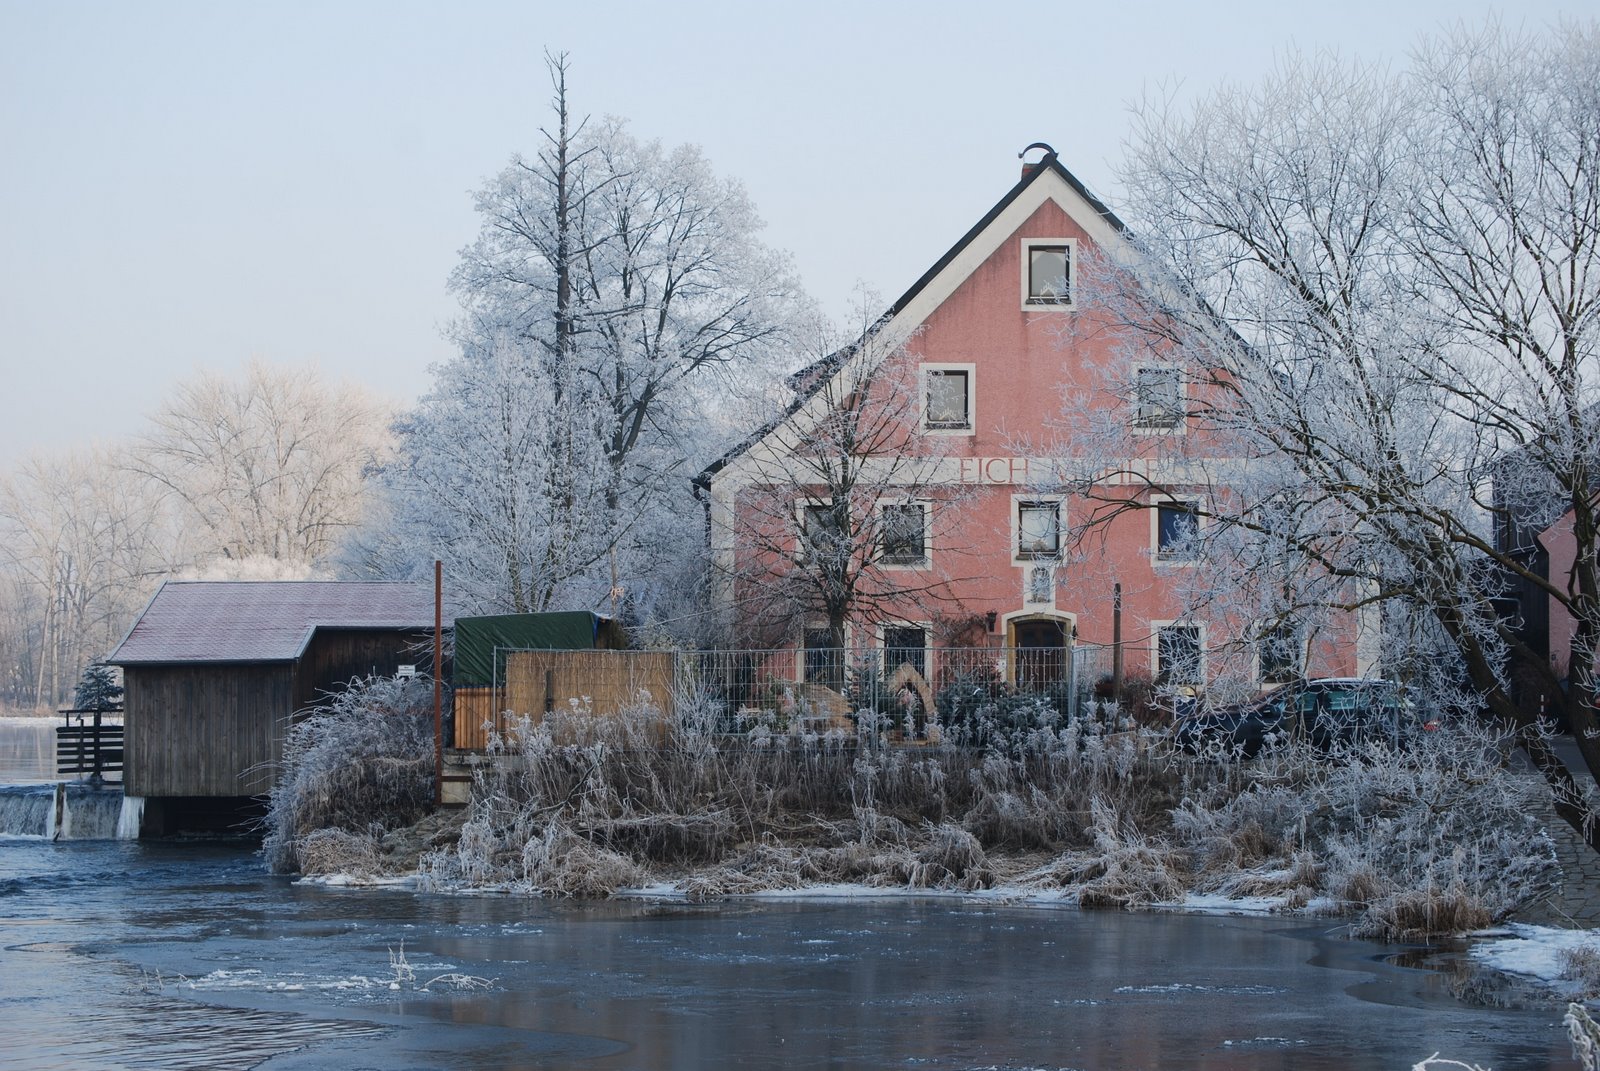
Jumping on the bandwagon, I though I would share this picture taken last year of the Eich Mühle, on the Regen in Regesnstauf in a very Christmassy Bavaria. Merry Christmas, Happy Holidays, and a safe and prosperous New Year!