Recent Posts

The Death of Swurl


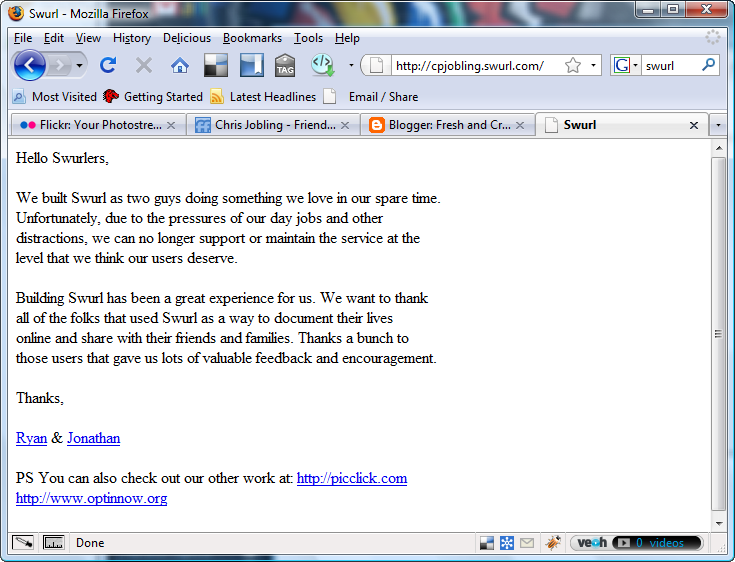
Swurl was a lifestreaming tool with a great interface that I was subscribed to since I read about it in Read Write Web back in July last year. Unfortunately, without warning, it’s now gone and taken my life with it! All that is left is the apologetic note illustrated.

Luckily I still have my friend-feed, tumblr blog and netvibes home page.

Moral: don’t get too attached to a single Web 2.0 service! In the current economic climate, there’ll be a few that fall by the wayside.

More on Euler

I am grateful to my friend and former Swansea colleague Dr Farzin Deravi of University of Kent at Canterbury who read my blog post on Euler’s identity (“The Most Beautiful Equation in the World”) via Facebook and told me about this video proof of the equation:

It’s well put together, but for me crucially omits the vital step that substitutes cos ? = -1 and sin ? = 0 to reduce e_i_? = cos ? – i sin ? to e_i_? = –1 + 0 which of course can be rearranged to give e_i_? + 1 = 0.

This was not the only “Euler Video” available on YouTube, looking further, I found this nice example, also a proof of Euler’s identity, that shows what you can do with a tablet and screen recording software.

Two very inspirational demonstrations of the power of video in the teaching of mathematical concepts.

How many blogs is too many?

I regularly post to three blogs. This one, which used to be work related, is now sort of miscellaneous. I try to keep my other blog @the.coalface, which is a multi-user WordPress blog hosted at my University, focussed on my reflections on my experiments with education technology. And I am a regular contributor to the Swansea Learning Lab community blog, where I typically re-post interesting items of e-learning inspiration and that I find in my daily trawl of my RSS feeds. 

However, it seems that I could do even more. As a member of the Eduspaces and Classroom2.0 community networks, I have two more blogs available to me. As an academic I have an entry on Academia.edu and could have a blog. I microblog on Twitter. I share favourites from Google Reader, my delicious bookmarks and some of my photos on Flickr. I even have some module related blogs in Blackboard for some of the courses that I teach. So is this all too much? Am I spreading myself too thin?

I have dabbled with various ways to aggregate all these strands of my life on line. For example, I have created a Swurl page, a FriendFeed, a Tumblr blog and a Netvibes public page. I even have a Yahoo! Pipe which aggregates some (but not all) of these and generates an RSS feed!

So which is the real me? Which should you follow?

The Most Beautiful Equation in the World

According to some, Euler’s identity is one of the most beautiful mathematical expressions in the world. The identity is
1 + e__i? = 0 (although electrical engineers like myself are more familiar with seeing it written as 1 + e__j? = 0).

DSC_0155*
Euler’s Identity, Technical Museum Berlin*

On a recent visit to the Mathema Exhibition at the German Technical Museum, Berlin, I took this photo of some art that represents this equation.

Lots of people like to take a break by sitting in the zero.

Why so beautiful? Because it neatly ties together five of the most mysterious numbers in Mathematics: 0, 1, e, ? and the square root of –1.

What does it mean? Euler’s formula is essentially a statement of the transformation from cartesian coordinates to polar coordinates for imaginary numbers: that is numbers that have a real part represented as a point on the x-axis, and an imaginary part that is represented by a point on the y-axis. It takes the general form
*
eix* = cos x +* i* sin x.

For the special case when x = ?: sin ? = 0 and cos ? = -1, thus ei? = -1 or ei? + 1 = 0.
How to write up a dissertation: Referencing

In about four weeks I will be giving a lecture to the Level 3 Engineering Dissertation class on proper referencing. I will probably want to cover the following ground:

  • Plagiarism (or how not to reference)
  • How to reference
  • A couple of referencing styles (I was thinking numerical and Havard styles).
  • Referencing tools: Word 2007, Zotero, Endnote.

There is a brief guide to bibliographic referencing that has been provided by the Library and Information Service at Swansea University which I will use, but I am also looking for examples of plagiarism that I can cite (properly) and any pointers to good on-line resources for using the referencing tools.

In a (very) brief Google search session I came across this nice interactive tutorial from Arcadia University that can be used in the lecture. I will tag others in my delicious feed using tags eg-353+referencing.

Hopefully, the resulting presentation will be good enough to join my existing presentation on How to Write a Technical Report on SlideShare.

The Catch 22 of Academic Publishing

A couple of interesting articles crossed my on-line reading list today. First of all, Chris Hall from the Swansea Learning lab posted a delicious.com bookmark to a Times Higher Education article which reported on a JISC Report on new models for academic publishing which concludes that “an “open-access” future for academic publishing would save money while boosting the profile of research and maximising its economic impact.” In The Guardian Technology supplement, Andrew Brown presents a similar argument in today’s Read me first column: “Digital Britain needs access to science journals, not YouTube.”

Unfortunately the curious mutually dependent relationship between the Academy and Academic publishing leads me to think that this is not going to change any time soon. Quality publications in peer-reviewed journals continues to be the metric that drives probation, tenure and promotion of staff and even the assessment of the Universities themselves. At the same time these same quality journals are controlled by the cartel of academic publishers, and are accessible, and therefore read, only by academics through the libraries that can afford the expensive annual subscriptions. It’s a real Catch 22 situation: academics need the journals and the journals need the academics to need the journals. The next RAE exercise, which will be based on publication impact metrics, will not use the economic benefits of publications, but rather which journal it is published in and who else has read and cited the paper. And this is only likely to strengthen the hold of the academic publishers. It would in fact be mutually assured destruction if the publishing model changed, even if the change would have a clear economic benefit.

I think there’s a clue in the name we give these publications. They are called archival journals, perhaps because they are archived, rather than read.

Snow!

The snow finally arrived in Swansea but brought with it the usual British “severe weather” madness. I received a Twitter tweet from a colleague that said that the University was closed and because I couldn’t believe it: I walked out into the pleasant wintry day to see if it was true. And it was! The entire staff was sent home at around 9.00 am. Students flooding in from Brynmill were turned away from lectures and were able to build snowmen and have snowball fights instead. This evening’s cinema performance at Taliesin was even cancelled. In terms of lost man hours, catering receipts and returned cinema tickets the University must have lost a fortune! And all those lost lectures will have to made up some how.

The irony was I could and did make it into work without problems! And so did many of my colleagues and students. If you want to know why Britain is going down the toilet, you need look no further than to how the nation reacts to a bit of snow!

At least, as we were told by the personnel manager later today, we won’t be docked a day’s wages!

Stop Press: The sun came out at 13.00 and already most of the productivity-stopping snow has already melted!

Posted by Picasa

Snow?

Snow in Singleton park 

According to the BBC, snow falls today caused major disruption to normal sevice of UK PLC. In Swansea, we had a light dusting as this shot of my route into work shows. Light snow showers expected tonight.

Posted by Picasa

Displaying Pie Charts with Google Chart API

<img src="http://blog.swansea.ac.uk/blog/eechris/2009/01/30/reflections-on-some-e-learning-feedback-part-1/" alt="Sample chart](http://chart.apis.google.com/chart?chs=350x150&chd=t:60,40&cht=p&chl=Strongly Agree|Strongly Disagree)

In one of my [current projects " title="" />I am publishing the results (in blog form) of the first assessment of my use of e-learning that I have ever formally tried. The majority of the questions use the Likert scale (where respondees are asked to rank their response to a statement along the scale of Strongly-agree to Strongly disagree) and I want to present the results with pie charts like this one. I could use Excel and export the charts, as gif images, for upload to my blog, but that’s not very Web 2.0! So instead I thought I’d use the Google Chart API instead. And here is an example of what can be achieved with a small bit of HTML magic.

The Google Chart API is a web service: you provide some information about the chart you want and it generates and returns a GIF image of the chart. The URL for the chart shown in this post is http://chart.apis.google.com/chart?chs=350×150&chd=t:60,40&cht=p&chl=Strongly Agree|Strongly Disagree. To embed a chart in an HTML document, just use the Chart API URL as the src attribute of an image as in:

&lt!-- Use of & in the src attribute to stand for the & in the URL
is not a spelling mistake!
You have to use the HTML entity in order to be able to embed &
in the URL! -->
Sample chartsrc="http://chart.apis.google.com/chart?chs=350x150
&chd=t:60,40
&cht=p
&aongly Agree|Strongly Disagree" />

<

p>Clearly, some familiarity with HTML is required to fully exploit this feature, but it’s well worth a look. Plus if you have a number of similar charts to produce, as my report will, you’ll probably find copy, paste and tweek to be much quicker than anything you could do with traditional desktop tools.